|
||||||
The Bureau of Ocean Energy Management (BOEM) manages and disseminates the Submerged Lands Act federal/state boundaries. Electronic data is here. Go to the links under “GIS Data / Shapefiles” to download data for a specific region. Note: the Gulf of Mexico dataset is in the sub-link, "Gulf of Mexico Geographic Mapping Data." The U.S. maritime limits are projected from a "normal baseline" derived from NOAA nautical charts. A "normal baseline" (as defined in the 1958 Geneva Convention on the Territorial Sea and the Contiguous Zone and Article 5 of the United Nations Convention of the Law of the Sea) is the low-water line along the coast as marked on offical, large-scale charts. Since "low-water line" does not reference a specific tidal datum, the U.S. applies the term to reference the lowest charted datum, which is mean lower low water (MLLW).
The maritime limits are created using “envelope of arcs,” a method by which one rolls a virtual circle along the charted low The U.S. Baseline Committee reviews and approves the limits of all maritime zones on NOAA charts. It gains interagency consensus on the proper location of the baseline, using the provisions of the 1958 Convention on the Territorial Sea and the Contiguous Zone, to ensure that the seaward extents of U.S. maritime zones do not exceed the breadth permitted by international law. Current members of the Committee include the Departments of State (Chair), Commerce (NOAA), Justice, Interior (BOEM), and Homeland Security (Coast Guard), among others. Depending on the level of change as well as the chart production schedule (see Standing Over Notice ), the Office of Coast survey may update the digital U.S. maritime limits and boundaries as often as every few months in certain localized areas. Though we provide both dyanmic and static datasets, we recommend using our dynamic data services to ensure the most up-to-date version of the U.S. maritime limits and boundaries. We provide an archive of past updates to explain what has changed in each release of the data. We offer dynamic data is two formats: OpenGIS ® Web Map Service (WMS) and proprietary ESRI REST service.
The WMS can be used in various desktop GIS software as well as web mapping applications. The WMS link leads to the GetCapabilities page, which provides easy-to-read, detailed information about the data as well as the necessary link to load the data into a GIS or web mapping application. Open Geospatial Consortium (OGC) provides more information about web mapping services.
For users who prefer to work within the ESRI software environment, we provide an ESRI REST (Representational State Transfer) service. This service can be used in ESRI’s ArcGIS Desktop software or in ESRI’s free ArcGIS Explorer Desktop. It can also be added as a layer in web mapping services, such as ArcGIS Online.
Boundary ID: a unique identifier of the boundary segment
We find that most people who seek this line are actually looking for the Submerged Lands Act federal/state boundary provided by BOEM (see FAQ #1). For those seeking the ambulatory three nautical mile territorial sea limit, we recommend that you use the seamless raster nautical chart service provided by the Office of Coast Survey. Additional Information |
||||||
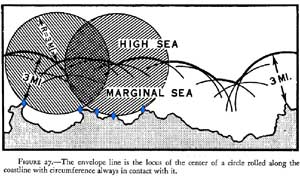 water line and selects salient points. These salient points are called "contributing baseline points." Arcs generated from these baseline points are blended together to form a continuous limit line or envelope of arcs.

